


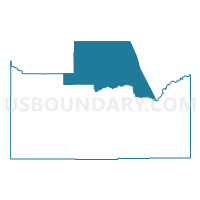
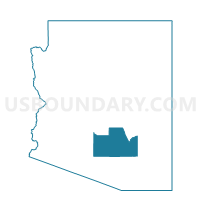
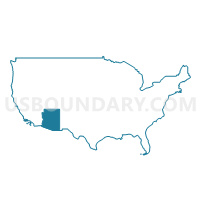
North Pinal CCD, Pinal County, Arizona
About
Outline

Summary
| Unique Area Identifier | 122811 |
| Name | North Pinal CCD |
| County | Pinal County |
| State | Arizona |
| Area (square miles) | 1,009.54 |
| Land Area (square miles) | 1,008.08 |
| Water Area (square miles) | 1.46 |
| % of Land Area | 99.86 |
| % of Water Area | 0.14 |
| Latitude of the Internal Point | 33.25436150 |
| Longtitude of the Internal Point | -111.25293600 |
| Total Population | 152,330 |
| Total Housing Units | 71,751 |
| Total Households | 55,273 |
| Median Age | 35.4 |
Maps
Graphs
Select a template below for downloading or customizing gragh for North Pinal CCD, Pinal County, Arizona


Neighbors
Neighoring County Subdivision (by Name) Neighboring County Subdivision on the Map
- Chandler CCD, Maricopa County, AZ
- Florence CCD, Pinal County, AZ
- Gila River CCD, Pinal County, AZ
- Globe-Miami CCD, Gila County, AZ
- Phoenix CCD, Maricopa County, AZ
- San Manuel CCD, Pinal County, AZ
- Tonto National Forest CCD, Maricopa County, AZ
- Winkelman CCD, Gila County, AZ
Top 10 Neighboring Place (by Population) Neighboring Place on the Map
- Mesa city, AZ (439,041)
- San Tan Valley CDP, AZ (81,321)
- Apache Junction city, AZ (35,840)
- Queen Creek town, AZ (26,361)
- Florence town, AZ (25,536)
- Gold Canyon CDP, AZ (10,159)
- Superior town, AZ (2,837)
- Kearny town, AZ (1,950)
- Queen Valley CDP, AZ (788)
- Hayden town, AZ (662)
Top 10 Neighboring Unified School District (by Population) Neighboring Unified School District on the Map
- Mesa Unified District, AZ (453,632)
- Chandler Unified District, AZ (220,791)
- Gilbert Unified District, AZ (184,433)
- Florence Unified School District, AZ (70,940)
- School District Not Defined, AZ (69,809)
- Apache Junction Unified District, AZ (56,919)
- J. O. Combs Unified School District, AZ (34,868)
- Coolidge Unified District, AZ (34,472)
- Queen Creek Unified District, AZ (26,329)
- Miami Unified District, AZ (7,534)
Top 10 Neighboring State Legislative District Lower Chamber (by Population) Neighboring State Legislative District Lower Chamber on the Map
- State House District 23, AZ (370,479)
- State House District 22, AZ (297,687)
- State House District 21, AZ (274,260)
- State House District 19, AZ (195,221)
- State House District 5, AZ (192,258)
Top 10 Neighboring State Legislative District Upper Chamber (by Population) Neighboring State Legislative District Upper Chamber on the Map
- State Senate District 23, AZ (370,479)
- State Senate District 22, AZ (297,687)
- State Senate District 21, AZ (274,260)
- State Senate District 19, AZ (195,221)
- State Senate District 5, AZ (192,258)
Top 10 Neighboring 111th Congressional District (by Population) Neighboring 111th Congressional District on the Map
- Congressional District 6, AZ (971,733)
- Congressional District 7, AZ (855,769)
- Congressional District 1, AZ (774,310)
- Congressional District 5, AZ (656,833)
Top 10 Neighboring Census Tract (by Population) Neighboring Census Tract on the Map
- Census Tract 2.05, Pinal County, AZ (15,769)
- Census Tract 8.03, Pinal County, AZ (12,149)
- Census Tract 2.13, Pinal County, AZ (12,093)
- Census Tract 2.07, Pinal County, AZ (11,032)
- Census Tract 2.14, Pinal County, AZ (9,099)
- Census Tract 8.01, Pinal County, AZ (8,774)
- Census Tract 2.09, Pinal County, AZ (8,511)
- Census Tract 2.10, Pinal County, AZ (8,472)
- Census Tract 4226.46, Maricopa County, AZ (7,730)
- Census Tract 3.16, Pinal County, AZ (7,377)
Top 10 Neighboring 5-Digit ZIP Code Tabulation Area (by Population) Neighboring 5-Digit ZIP Code Tabulation Area on the Map
- 85142, AZ (48,870)
- 85207, AZ (44,744)
- 85209, AZ (37,377)
- 85140, AZ (36,711)
- 85143, AZ (35,015)
- 85208, AZ (34,762)
- 85132, AZ (33,556)
- 85120, AZ (28,168)
- 85212, AZ (24,492)
- 85119, AZ (21,219)
Data
Demographic, Population, Households, and Housing Units
** Data sources from census 2010 **
Show Data on Map
Download Full List as CSV
Download Quick Sheet as CSV
| Subject | This Area | Pinal County | Arizona | National |
|---|---|---|---|---|
| POPULATION | ||||
| Total Population Map | 152,330 | 375,770 | 6,392,017 | 308,745,538 |
| POPULATION, HISPANIC OR LATINO ORIGIN | ||||
| Not Hispanic or Latino Map | 121,966 | 268,793 | 4,496,868 | 258,267,944 |
| Hispanic or Latino Map | 30,364 | 106,977 | 1,895,149 | 50,477,594 |
| POPULATION, RACE | ||||
| White alone Map | 127,026 | 272,013 | 4,667,121 | 223,553,265 |
| Black or African American alone Map | 4,918 | 17,215 | 259,008 | 38,929,319 |
| American Indian and Alaska Native alone Map | 1,619 | 20,949 | 296,529 | 2,932,248 |
| Asian alone Map | 2,287 | 6,492 | 176,695 | 14,674,252 |
| Native Hawaiian and Other Pacific Islander alone Map | 292 | 1,565 | 12,648 | 540,013 |
| Some Other Race alone Map | 11,085 | 43,213 | 761,716 | 19,107,368 |
| Two or More Races Map | 5,103 | 14,323 | 218,300 | 9,009,073 |
| POPULATION, SEX | ||||
| Male Map | 75,046 | 197,165 | 3,175,823 | 151,781,326 |
| Female Map | 77,284 | 178,605 | 3,216,194 | 156,964,212 |
| POPULATION, AGE (18 YEARS) | ||||
| 18 years and over Map | 108,869 | 276,070 | 4,763,003 | 234,564,071 |
| Under 18 years | 43,461 | 99,700 | 1,629,014 | 74,181,467 |
| POPULATION, AGE | ||||
| Under 5 years | 13,403 | 30,182 | 455,715 | 20,201,362 |
| 5 to 9 years | 12,880 | 29,021 | 453,680 | 20,348,657 |
| 10 to 14 years | 11,437 | 26,374 | 448,664 | 20,677,194 |
| 15 to 17 years | 5,741 | 14,123 | 270,955 | 12,954,254 |
| 18 and 19 years | 2,977 | 8,527 | 190,627 | 9,086,089 |
| 20 years | 1,334 | 4,139 | 93,756 | 4,519,129 |
| 21 years | 1,259 | 3,968 | 89,342 | 4,354,294 |
| 22 to 24 years | 4,324 | 13,064 | 259,486 | 12,712,576 |
| 25 to 29 years | 10,256 | 27,603 | 439,998 | 21,101,849 |
| 30 to 34 years | 11,699 | 29,143 | 416,695 | 19,962,099 |
| 35 to 39 years | 10,870 | 27,212 | 415,693 | 20,179,642 |
| 40 to 44 years | 8,940 | 23,147 | 406,801 | 20,890,964 |
| 45 to 49 years | 8,630 | 22,659 | 427,022 | 22,708,591 |
| 50 to 54 years | 8,451 | 21,729 | 415,524 | 22,298,125 |
| 55 to 59 years | 8,449 | 20,754 | 375,268 | 19,664,805 |
| 60 and 61 years | 3,678 | 8,688 | 144,092 | 7,113,727 |
| 62 to 64 years | 5,504 | 13,366 | 206,868 | 9,704,197 |
| 65 and 66 years | 3,411 | 8,090 | 119,102 | 5,319,902 |
| 67 to 69 years | 4,614 | 11,002 | 163,764 | 7,115,361 |
| 70 to 74 years | 6,066 | 14,163 | 215,026 | 9,278,166 |
| 75 to 79 years | 4,105 | 9,356 | 162,261 | 7,317,795 |
| 80 to 84 years | 2,570 | 5,733 | 118,278 | 5,743,327 |
| 85 years and over | 1,732 | 3,727 | 103,400 | 5,493,433 |
| MEDIAN AGE BY SEX | ||||
| Both sexes Map | 35.40 | 35.30 | 35.90 | 37.20 |
| Male Map | 34.90 | 34.80 | 34.80 | 35.80 |
| Female Map | 35.90 | 36.00 | 37.20 | 38.50 |
| HOUSEHOLDS | ||||
| Total Households Map | 55,273 | 125,590 | 2,380,990 | 116,716,292 |
| HOUSEHOLDS, HOUSEHOLD TYPE | ||||
| Family households: Map | 40,260 | 92,157 | 1,576,520 | 77,538,296 |
| Husband-wife family Map | 31,868 | 70,106 | 1,146,036 | 56,510,377 |
| Other family: Map | 8,392 | 22,051 | 430,484 | 21,027,919 |
| Male householder, no wife present Map | 2,908 | 7,399 | 134,171 | 5,777,570 |
| Female householder, no husband present Map | 5,484 | 14,652 | 296,313 | 15,250,349 |
| Nonfamily households: Map | 15,013 | 33,433 | 804,470 | 39,177,996 |
| Householder living alone Map | 11,517 | 25,699 | 621,008 | 31,204,909 |
| Householder not living alone Map | 3,496 | 7,734 | 183,462 | 7,973,087 |
| HOUSEHOLDS, HISPANIC OR LATINO ORIGIN OF HOUSEHOLDER | ||||
| Not Hispanic or Latino householder: Map | 47,594 | 100,329 | 1,880,167 | 103,254,926 |
| Hispanic or Latino householder: Map | 7,679 | 25,261 | 500,823 | 13,461,366 |
| HOUSEHOLDS, RACE OF HOUSEHOLDER | ||||
| Householder who is White alone | 48,528 | 101,219 | 1,892,326 | 89,754,352 |
| Householder who is Black or African American alone | 1,613 | 4,798 | 92,994 | 14,129,983 |
| Householder who is American Indian and Alaska Native alone | 486 | 4,671 | 82,898 | 939,707 |
| Householder who is Asian alone | 686 | 1,685 | 57,594 | 4,632,164 |
| Householder who is Native Hawaiian and Other Pacific Islander alone | 81 | 173 | 3,443 | 143,932 |
| Householder who is Some Other Race alone | 2,869 | 10,220 | 200,098 | 4,916,427 |
| Householder who is Two or More Races | 1,010 | 2,824 | 51,637 | 2,199,727 |
| HOUSEHOLDS, HOUSEHOLD TYPE BY HOUSEHOLD SIZE | ||||
| Family households: Map | 40,260 | 92,157 | 1,576,520 | 77,538,296 |
| 2-person household Map | 17,531 | 40,163 | 665,956 | 31,882,616 |
| 3-person household Map | 7,428 | 16,866 | 322,155 | 17,765,829 |
| 4-person household Map | 7,249 | 16,147 | 288,309 | 15,214,075 |
| 5-person household Map | 4,509 | 10,104 | 162,449 | 7,411,997 |
| 6-person household Map | 2,127 | 5,045 | 76,255 | 3,026,278 |
| 7-or-more-person household Map | 1,416 | 3,832 | 61,396 | 2,237,501 |
| Nonfamily households: Map | 15,013 | 33,433 | 804,470 | 39,177,996 |
| 1-person household Map | 11,517 | 25,699 | 621,008 | 31,204,909 |
| 2-person household Map | 2,945 | 6,505 | 148,999 | 6,360,012 |
| 3-person household Map | 351 | 780 | 22,171 | 992,156 |
| 4-person household Map | 133 | 285 | 8,346 | 411,171 |
| 5-person household Map | 47 | 106 | 2,495 | 126,634 |
| 6-person household Map | 11 | 36 | 840 | 48,421 |
| 7-or-more-person household Map | 9 | 22 | 611 | 34,693 |
| HOUSING UNITS | ||||
| Total Housing Units Map | 71,751 | 159,222 | 2,844,526 | 131,704,730 |
| HOUSING UNITS, OCCUPANCY STATUS | ||||
| Occupied Map | 55,273 | 125,590 | 2,380,990 | 116,716,292 |
| Vacant Map | 16,478 | 33,632 | 463,536 | 14,988,438 |
| HOUSING UNITS, OCCUPIED, TENURE | ||||
| Owned with a mortgage or a loan Map | 32,087 | 67,766 | 1,132,662 | 52,979,430 |
| Owned free and clear Map | 11,551 | 27,863 | 439,025 | 23,006,644 |
| Renter occupied Map | 11,635 | 29,961 | 809,303 | 40,730,218 |
| HOUSING UNITS, VACANT, VACANCY STATUS | ||||
| For rent Map | 1,762 | 4,887 | 120,490 | 4,137,567 |
| Rented, not occupied Map | 192 | 333 | 5,449 | 206,825 |
| For sale only Map | 2,913 | 5,660 | 64,407 | 1,896,796 |
| Sold, not occupied Map | 417 | 917 | 10,550 | 421,032 |
| For seasonal, recreational, or occasional use Map | 9,136 | 15,499 | 184,327 | 4,649,298 |
| For migrant workers Map | 4 | 53 | 538 | 24,161 |
| Other vacant Map | 2,054 | 6,283 | 77,775 | 3,652,759 |
| HOUSING UNITS, OCCUPIED, AVERAGE HOUSEHOLD SIZE BY TENURE | ||||
| Total: Map | 2.75 | 2.78 | 2.63 | 2.58 |
| Owner occupied Map | 2.64 | 2.67 | 2.63 | 2.65 |
| Renter occupied Map | 3.17 | 3.16 | 2.62 | 2.44 |
| HOUSING UNITS, OCCUPIED, TENURE BY RACE OF HOUSEHOLDER | ||||
| Owner occupied: Map | 43,638 | 95,629 | 1,571,687 | 75,986,074 |
| Householder who is White alone Map | 38,823 | 80,333 | 1,324,907 | 63,446,275 |
| Householder who is Black or African American alone Map | 1,045 | 2,861 | 36,538 | 6,261,464 |
| Householder who is American Indian and Alaska Native alone Map | 329 | 2,619 | 47,653 | 509,588 |
| Householder who is Asian alone Map | 585 | 1,370 | 35,929 | 2,688,861 |
| Householder who is Native Hawaiian and Other Pacific Islander alone Map | 53 | 112 | 1,532 | 61,911 |
| Householder who is Some Other Race alone Map | 2,088 | 6,516 | 99,247 | 1,975,817 |
| Householder who is Two or More Races Map | 715 | 1,818 | 25,881 | 1,042,158 |
| Renter occupied: Map | 11,635 | 29,961 | 809,303 | 40,730,218 |
| Householder who is White alone Map | 9,705 | 20,886 | 567,419 | 26,308,077 |
| Householder who is Black or African American alone Map | 568 | 1,937 | 56,456 | 7,868,519 |
| Householder who is American Indian and Alaska Native alone Map | 157 | 2,052 | 35,245 | 430,119 |
| Householder who is Asian alone Map | 101 | 315 | 21,665 | 1,943,303 |
| Householder who is Native Hawaiian and Other Pacific Islander alone Map | 28 | 61 | 1,911 | 82,021 |
| Householder who is Some Other Race alone Map | 781 | 3,704 | 100,851 | 2,940,610 |
| Householder who is Two or More Races Map | 295 | 1,006 | 25,756 | 1,157,569 |
| HOUSING UNITS, OCCUPIED, TENURE BY HISPANIC OR LATINO ORIGIN OF HOUSEHOLDER | ||||
| Owner occupied: Map | 43,638 | 95,629 | 1,571,687 | 75,986,074 |
| Not Hispanic or Latino householder Map | 37,954 | 78,753 | 1,299,001 | 69,617,625 |
| Hispanic or Latino householder Map | 5,684 | 16,876 | 272,686 | 6,368,449 |
| Renter occupied: Map | 11,635 | 29,961 | 809,303 | 40,730,218 |
| Not Hispanic or Latino householder Map | 9,640 | 21,576 | 581,166 | 33,637,301 |
| Hispanic or Latino householder Map | 1,995 | 8,385 | 228,137 | 7,092,917 |
| HOUSING UNITS, OCCUPIED, TENURE BY HOUSEHOLD SIZE | ||||
| Owner occupied: Map | 43,638 | 95,629 | 1,571,687 | 75,986,074 |
| 1-person household Map | 9,209 | 19,254 | 353,988 | 16,453,569 |
| 2-person household Map | 17,696 | 39,764 | 608,970 | 27,618,605 |
| 3-person household Map | 5,829 | 12,706 | 221,739 | 12,517,563 |
| 4-person household Map | 5,418 | 11,565 | 197,439 | 10,998,793 |
| 5-person household Map | 3,136 | 6,691 | 104,232 | 5,057,765 |
| 6-person household Map | 1,437 | 3,302 | 47,784 | 1,965,796 |
| 7-or-more-person household Map | 913 | 2,347 | 37,535 | 1,373,983 |
| Renter occupied: Map | 11,635 | 29,961 | 809,303 | 40,730,218 |
| 1-person household Map | 2,308 | 6,445 | 267,020 | 14,751,340 |
| 2-person household Map | 2,780 | 6,904 | 205,985 | 10,624,023 |
| 3-person household Map | 1,950 | 4,940 | 122,587 | 6,240,422 |
| 4-person household Map | 1,964 | 4,867 | 99,216 | 4,626,453 |
| 5-person household Map | 1,420 | 3,519 | 60,712 | 2,480,866 |
| 6-person household Map | 701 | 1,779 | 29,311 | 1,108,903 |
| 7-or-more-person household Map | 512 | 1,507 | 24,472 | 898,211 |
Loading...